

Blog
Tableau Certification Exam Questions – Part 1
Tableau Certification Exam Questions - Part 1

This question is Part 1 of our free series of questions along with step by step video and Text based solutions for Tableau Certification Exam Question Dumps including Tableau Desktop Specialist Certification Exam Dumps and Tableau Desktop Certified Associate Exam Dumps. You will see similar questions in both above mentioned certification exams. In Specialist Exam you can expect 8 to 10 scenario based questions where as in Associate exam, it’s almost double. We strongly recommend to have a walk through such material before your real exam. All data sources used in these questions are available in Data Source Page at our website Menu.
Question AA
Use SPCL_Sample-Superstore-Subset Excel File and Using Orders sheets identify the unique products sold in 2012 whose sales value was less or equal to 5000. Provide the solution using the histogram with Bin Size of 5000.
Solution Concept
Solution of this question needs skills related to calculation and using different chart types to solve the scenario. Since in the question, it is recommended to use histograms to find the answer so we shall first solve this question by using histogram and then we shall share the concept how it can solved through alternative approach by creating a simple calculation field.
Note: if you want to practice this question on your PC, you can download the data source from data sources page from our website menu.
If you are not familiar with histograms, you can see the link Tableau help article for your additional knowledge related to histograms.
Watch Video Based Question Explanation and Solution
Text Based Solution
Approach 1 – By Creating Histogram
Open Tableau Desktop, Go to File menu navigation as shown below

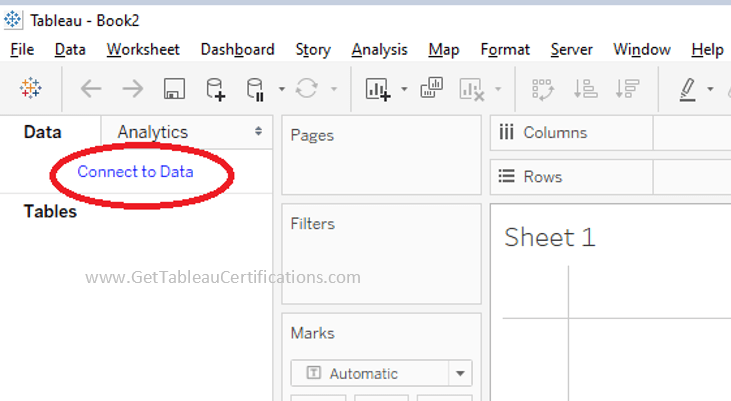
It will open a new blank workbook like following

Click on Connect to data
From following screen click the Excel data source option.

It will ask the location for the data source available on the system, select the correct data source file and load it, Once you select the excel data source file from your local PC, it will be loaded in the Tableau and will look like as following
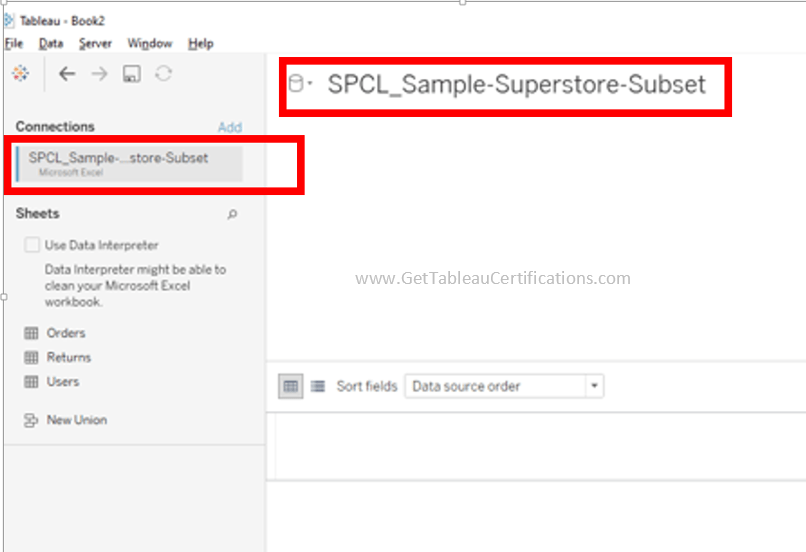
Select Orders Sheet and drop in the data pane

Its data will be visible and will look like this

Click on the sheet icon to create a new sheet as shown below

Select Order Date and drop in the filter pane

On the filters screen, click on Years Option and click next and select 2012 and click OK.

In order to create histogram for Sales, select the Sales measure

And click the show me option

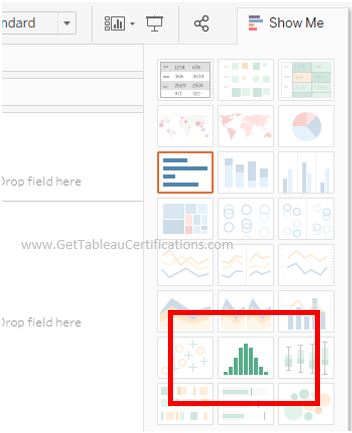
Clicking the Show Me option, shows the possible chart types feasible for selected measure.
Following charts option will be shown as enabled by default.

Click on Histogram option as shown below
It will create a histogram as shown below

By default, it automatically creates bins as per data range, created Bins can be seen from following screen

Following Bin size is created by default based on the data
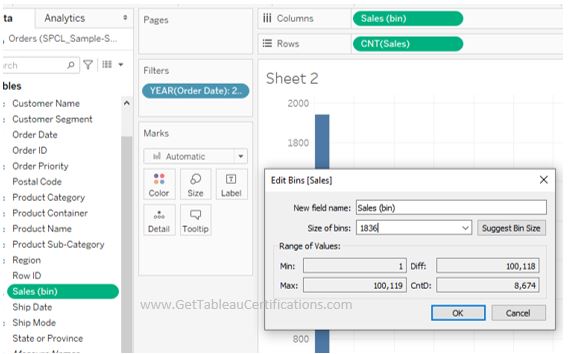
Edit Bin size and make its value to 5000 as follows

Since in the question they have asked to count the unique Products so let’s remove CNT(Sales) from Rows shelf.
Place Product Name in the Rows shelf as shown in the figure below.

Click on the COUNTD function with Product Name field as shown in the Rows Shelf

It will look this this

Now histogram looks like this

Enable the Labels by clicking on Label and enabling the check box
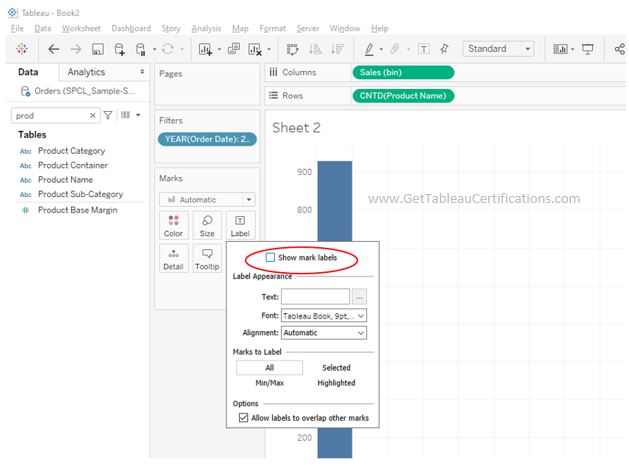
We can now see the values against ever bar

Notice that it is now showing the bars as per bin size which we had configured in steps above.
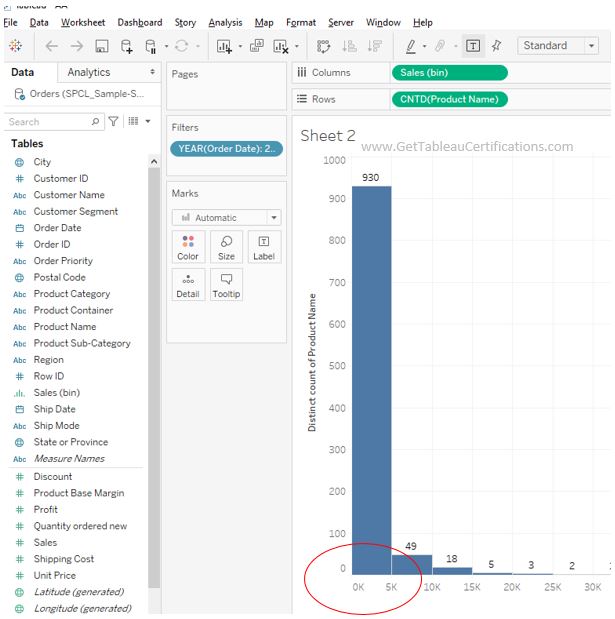
At this point, we have reached to our required answer which is 930. It means we have 930 unique products sold in year 2012 which have sales less than or equal to 5000.
Approach 2 – By creating a calculation field
Here comes another approach to solve the same question.
After you load the data source, create a calculated field as shown below

It will create a dimension as shown below

Select the Dimension “Sales Less than 5000” and drag it to filters pane, it will show following window

Click OK.
Now select the Order Date field and put it in the filters area

Select years Option and click next

Now select the year 2012 and click OK

Your view will look like this

Now select the Product Name field and put it on the Rows shelf

Since we need to get the count of distinct products so let us use the function to get the distinct count of product names.
Double click the Product Names field, it will make the field color as orange as shown below

Now you can write the function before field as show below

Once you will click enter, you view will look like this

Just enable the Label and you can see the result as follows
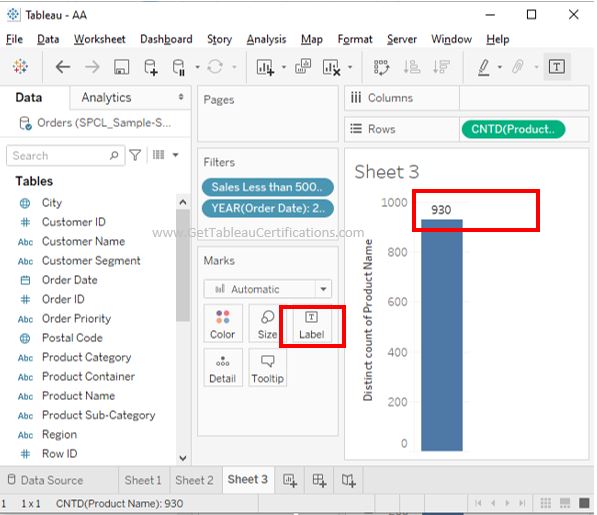
We can conclude that 930 is the desired result.
Related Links
For More Similar Video and Text Based Solutions – Click Here