

Blog
Tableau Certification Exam Question – Part 2
Tableau Certification Exam Questions - Part 2

This question is Part 2 of our free series of questions along with step by step video and Text based solutions for Tableau Certification Exam Question Dumps including Tableau Desktop Specialist Certification Exam Dumps and Tableau Desktop Certified Associate Exam Dumps. You will see similar questions in both above mentioned certification exams. In Specialist Exam you can expect 8 to 10 scenario based questions where as in Associate exam, it’s almost double. We strongly recommend to have a walk through such material before your real exam. All data sources used in these questions are available in Data Source Page at our website Menu.
Question AB
Use SPCL_Sample-Superstore-Subset Excel File and using Orders sheets, For Office Supplies, find the quantity ordered for the product ‘Xerox 1895’ in year 2012. Also find the product with lowest profit in the same year
Solution Concept
In this question, basic knowledge of Tableau Desktop is tested. Solution of this question will test your understanding of using filters, measures, and dimensions and how to sort data in Tableau. This question comprises of two parts. In this first, it is required to find the quantity ordered where as in second part of the question, it is required to find the product with lowest profit.
Note: if you want to practice this question on your PC, you can download the data source from data sources page from our website menu.
You can find more information on Tableau knowledge base about measures and dimensions likewise in order know about how sorting works in Tableau, you can read this article on Tableau.
Watch Video Based Question Explanation and Solution
Text Based Solution
First Part – To find the quantity
Open Tableau Desktop, Go to File menu navigation as shown below

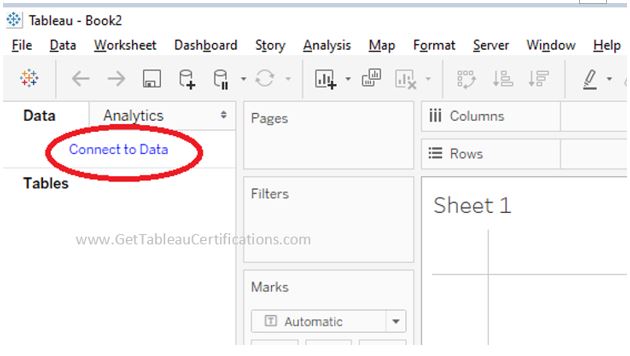
It will open a new blank workbook like following

Click on Connect to data
From following screen click the Excel data source option.

It will ask the location for the data source available on the system, select the correct data source file and load it, Once you select the excel data source file from your local PC, it will be loaded in the Tableau and will look like as following
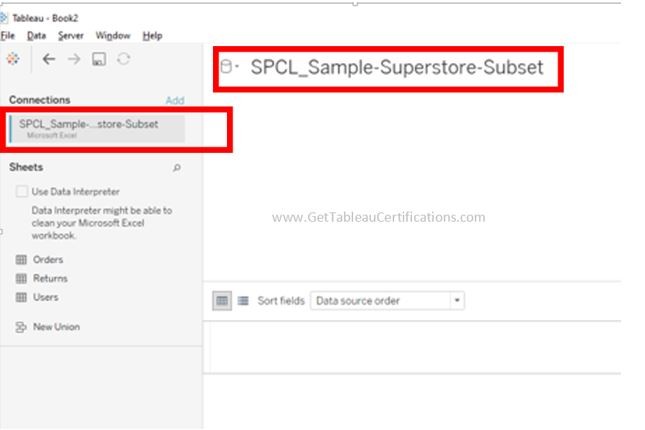
Select Orders Sheet and drop in the data pane

Its data will be visible and will look like this

Click on the sheet icon to create a new sheet as shown below

New Sheet will open like this

Select Product Name field and drag to filter pane

Following screen will appear

Type the product name as shown below and select the check box

Now select the product category and drag to the filters pane

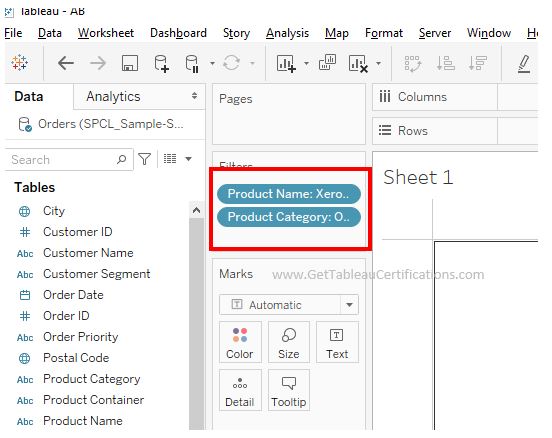
And select the Office Supplies as shown below

Both filters will be added in the filter pane
Now select the Order Date and drop in the filters pain to select the year

Select year option and click on next

And select 2012 from the filter options

After you click OK, we have got 3 filters in the filter pane which will help us to find the quantity for product Xerox 1895 for year 2012 for Office Supplies Product Category.
To find the quantity, let’s select the quantity measure and drag to Text area as shown below

It will show the quantity value

45 is the required answer for the first part of the question
Second Part – Find the product with lowest profit
In order to find the product with lowest profit, remove the Quantity from the Text and place the Profit in the Rows Shelf

Worksheet will look like this

Remove the Product Name from the Filters Area, since now we want to find the solution across all prodcuts

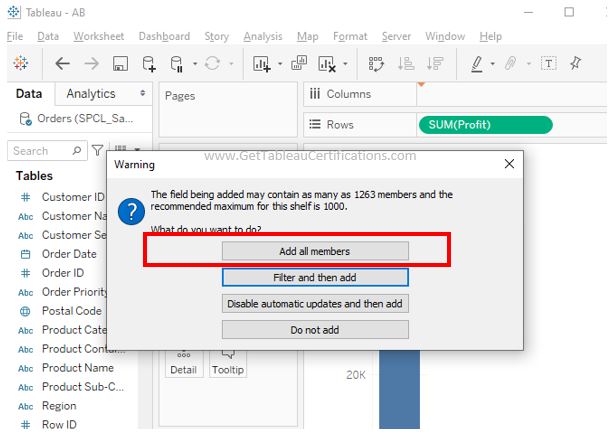
And put the Product Name in the Columns Shelf

It will give a message to add all members, this message comes when possible values list against a dimension is big
Sheet will look like this

Now click on the icon shown in the below diagram to change the axis
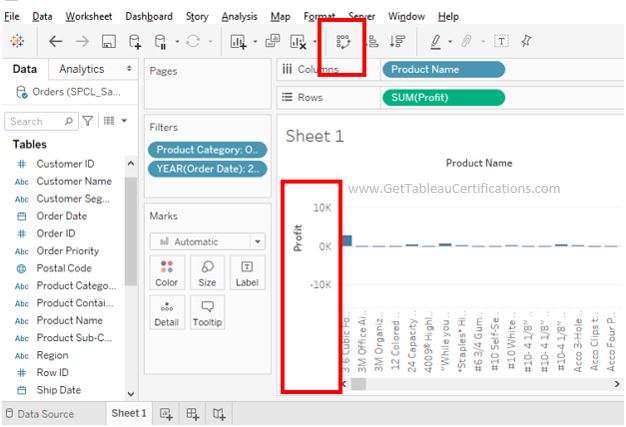
The work sheet axis will be exchanged with each other. Like in above screen shot, Profit was being displayed on Y axis but after pressing this Toggle Axis button now Profit axis will be displayed along X-axis

Now click on the Sort button, it will sort the data and click on label to will show the values.

Since the requirement is to reach to the product with lowest profit, so let us go to bottom of the graph since data is already sorted in the descending order.
Use scroll to go to the bottom of the graph
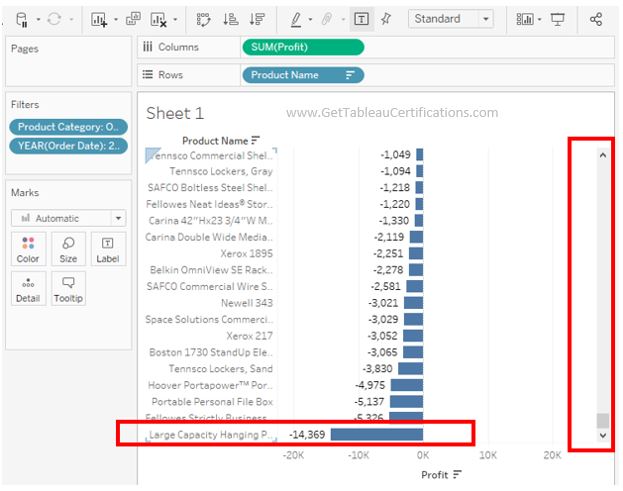
It’s obvious by looking at the above graph that Large Capacity Hanging Post Binders is the product with lowest profit in year 2012 which belongs to Office Supplies Product Category.
Related Links
For More Similar Video and Text Based Solutions – Click Here