

Blog
Tableau Certification Exam Question – Part 3
Tableau Certification Exam Questions - Part 3

This question is Part 3 of our free series of questions along with step by step video and Text based solutions for Tableau Certification Exam Question Dumps including Tableau Desktop Specialist Certification Exam Dumps and Tableau Desktop Certified Associate Exam Dumps. You will see similar questions in both above mentioned certification exams. In Specialist Exam you can expect 8 to 10 scenario based questions where as in Associate exam, it’s almost double. We strongly recommend to have a walk through such material before your real exam. All data sources used in these questions are available in Data Source Page at our website Menu.
Question AC
Question AC – Use SPCL_Sample-Superstore-Subset Excel File and using Orders sheets, Find the product sub category having the highest percent of growth in sales for year 2013
Solution Concept
In this question, we need to find the product sub category which is having the growth of sales in all years but we need to find the percent of growth in sales and compare across years. In order to reach the solution of this question, we have to use the concept of Table Calculations.
Note: if you want to practice this question on your PC, you can download the data source from data sources page from our website menu.
If you are not much familiar with the concept of Quick Table calculations, you can continue your learning journey and can read the following article from Tableau knowledge base.
Watch Video Based Question Explanation and Solution
Text Based Solution
Open Tableau Desktop, Go to File menu navigation as shown below

It will open a new blank workbook like following

Click on Connect to data

From following screen click the Excel data source option.

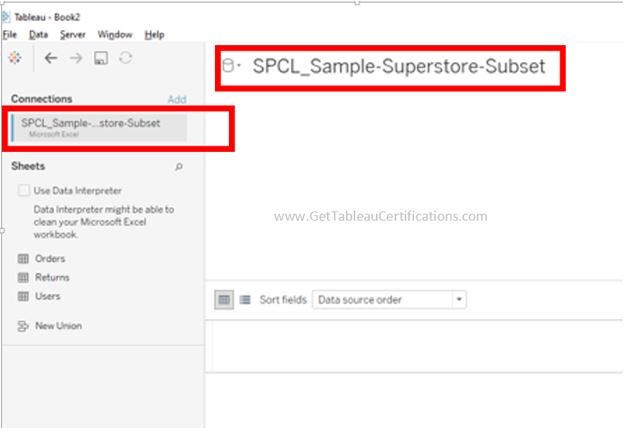
It will ask the location for the data source available on the system, select the correct data source file and load it, Once you select the excel data source file from your local PC, it will be loaded in the Tableau and will look like as following
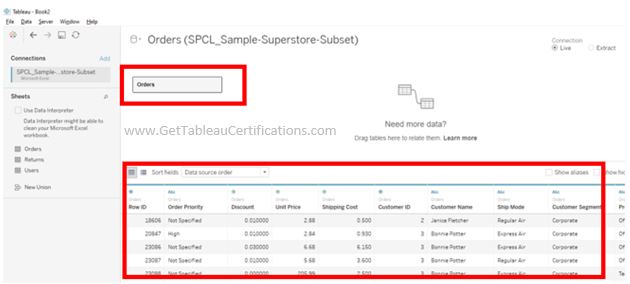
Select Orders Sheet and drop in the data pane

Its data will be visible and will look like this
Click on the sheet icon to create a new sheet as shown below

New Sheet will open like this

Select Product Sub Category and put it on the columns shelf as shown below

Sheet looks like this

Similarly select the Order Date and drag it to Rows shelf

Now we can see all years vertically and all product sub categories horizontally

Since we need to compare the data across years so it will be easier if we swap the axis. In order to sway the axis click the swap axis button as shown below

Sheet will look like this, you can notice that now years are displayed horizontally and products are displayed vertically

Now select the Sales measure and drag it to Text option as shown below

Now you can see the sales for all product for all years

Since in the question, it is asked to find the percentage difference of growth in sales across product sub categories across years, for this we shall use the Quick Table Calculations.
In order to use the table calculations, right click on the Sales measure and select the option as shown below
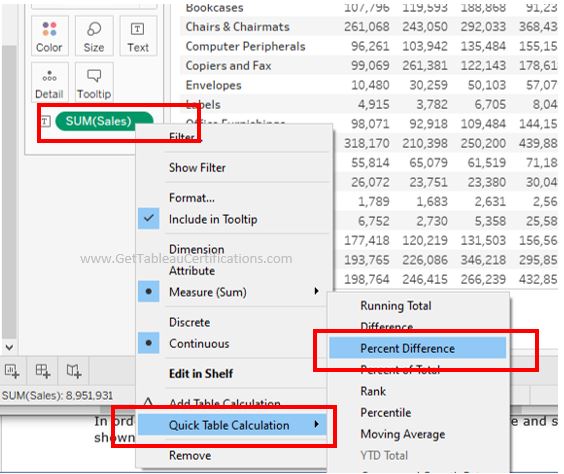
As soon as you select this option, your values will be changed and will reflect the percentages across all years.
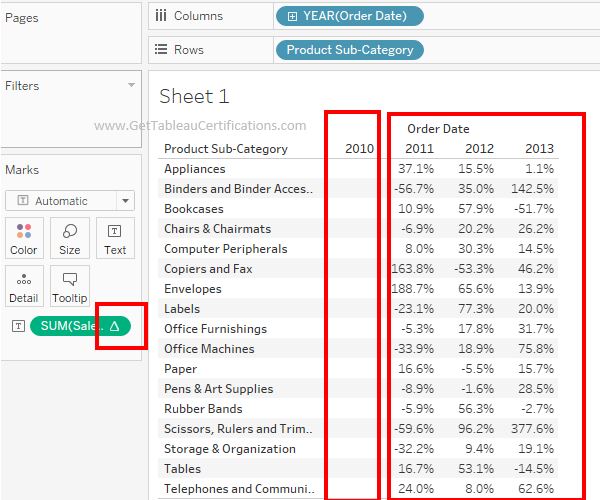
Notice that a small arrow sign has started appearing on the Sales measure, this is sign of Quick Table calculations.
Another point to note is that values for year 2010 has been disappeared, it is the default behavior of Percentage Difference Table Calculation that it starts the values from second year since percentage difference can be computed only from the second year onwards.
Now by seeing the data, it can be very easily identified that product sub category Scissors, Rulers and Trimmers has highest percentage of growth across all years.
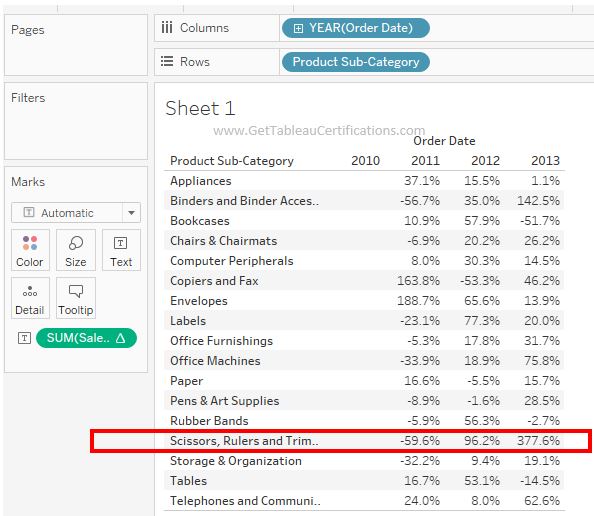
So the answer for this question is Scissors, Rulers and Trimmers.
Related Links
For More Similar Video and Text Based Solutions – Click Here